Lab 06: Debugging in Eclipse
Concepts
- A “Debugger” is a program that can attach itself to a JVM running your Java program in order to let you pause the execution of your program at specific points in your source code called “break points.” Once your program is paused, you can do many useful things. The two most useful things a Debugger lets you do are:
- See the value that variables actually have at run-time.
- “Step through” the execution of your code one line at a time.
- Together, these two features of Debuggers make it possible to see what your program is actually doing when it is running, which can be very useful in tracking down certain bugs.
- Debugging in Eclipse is very easy: Click the “Bug” icon
 to run your program with a debugger attached.
 - Not very much interesting will happen unless you have set up some breakpoints. To add a breakpoint, double-click to the left of any line of code:

No Breakpoint
Double-click on line 142…

Breakpoint Added
Now, the Debugger will pause the program right before line 142 runs.
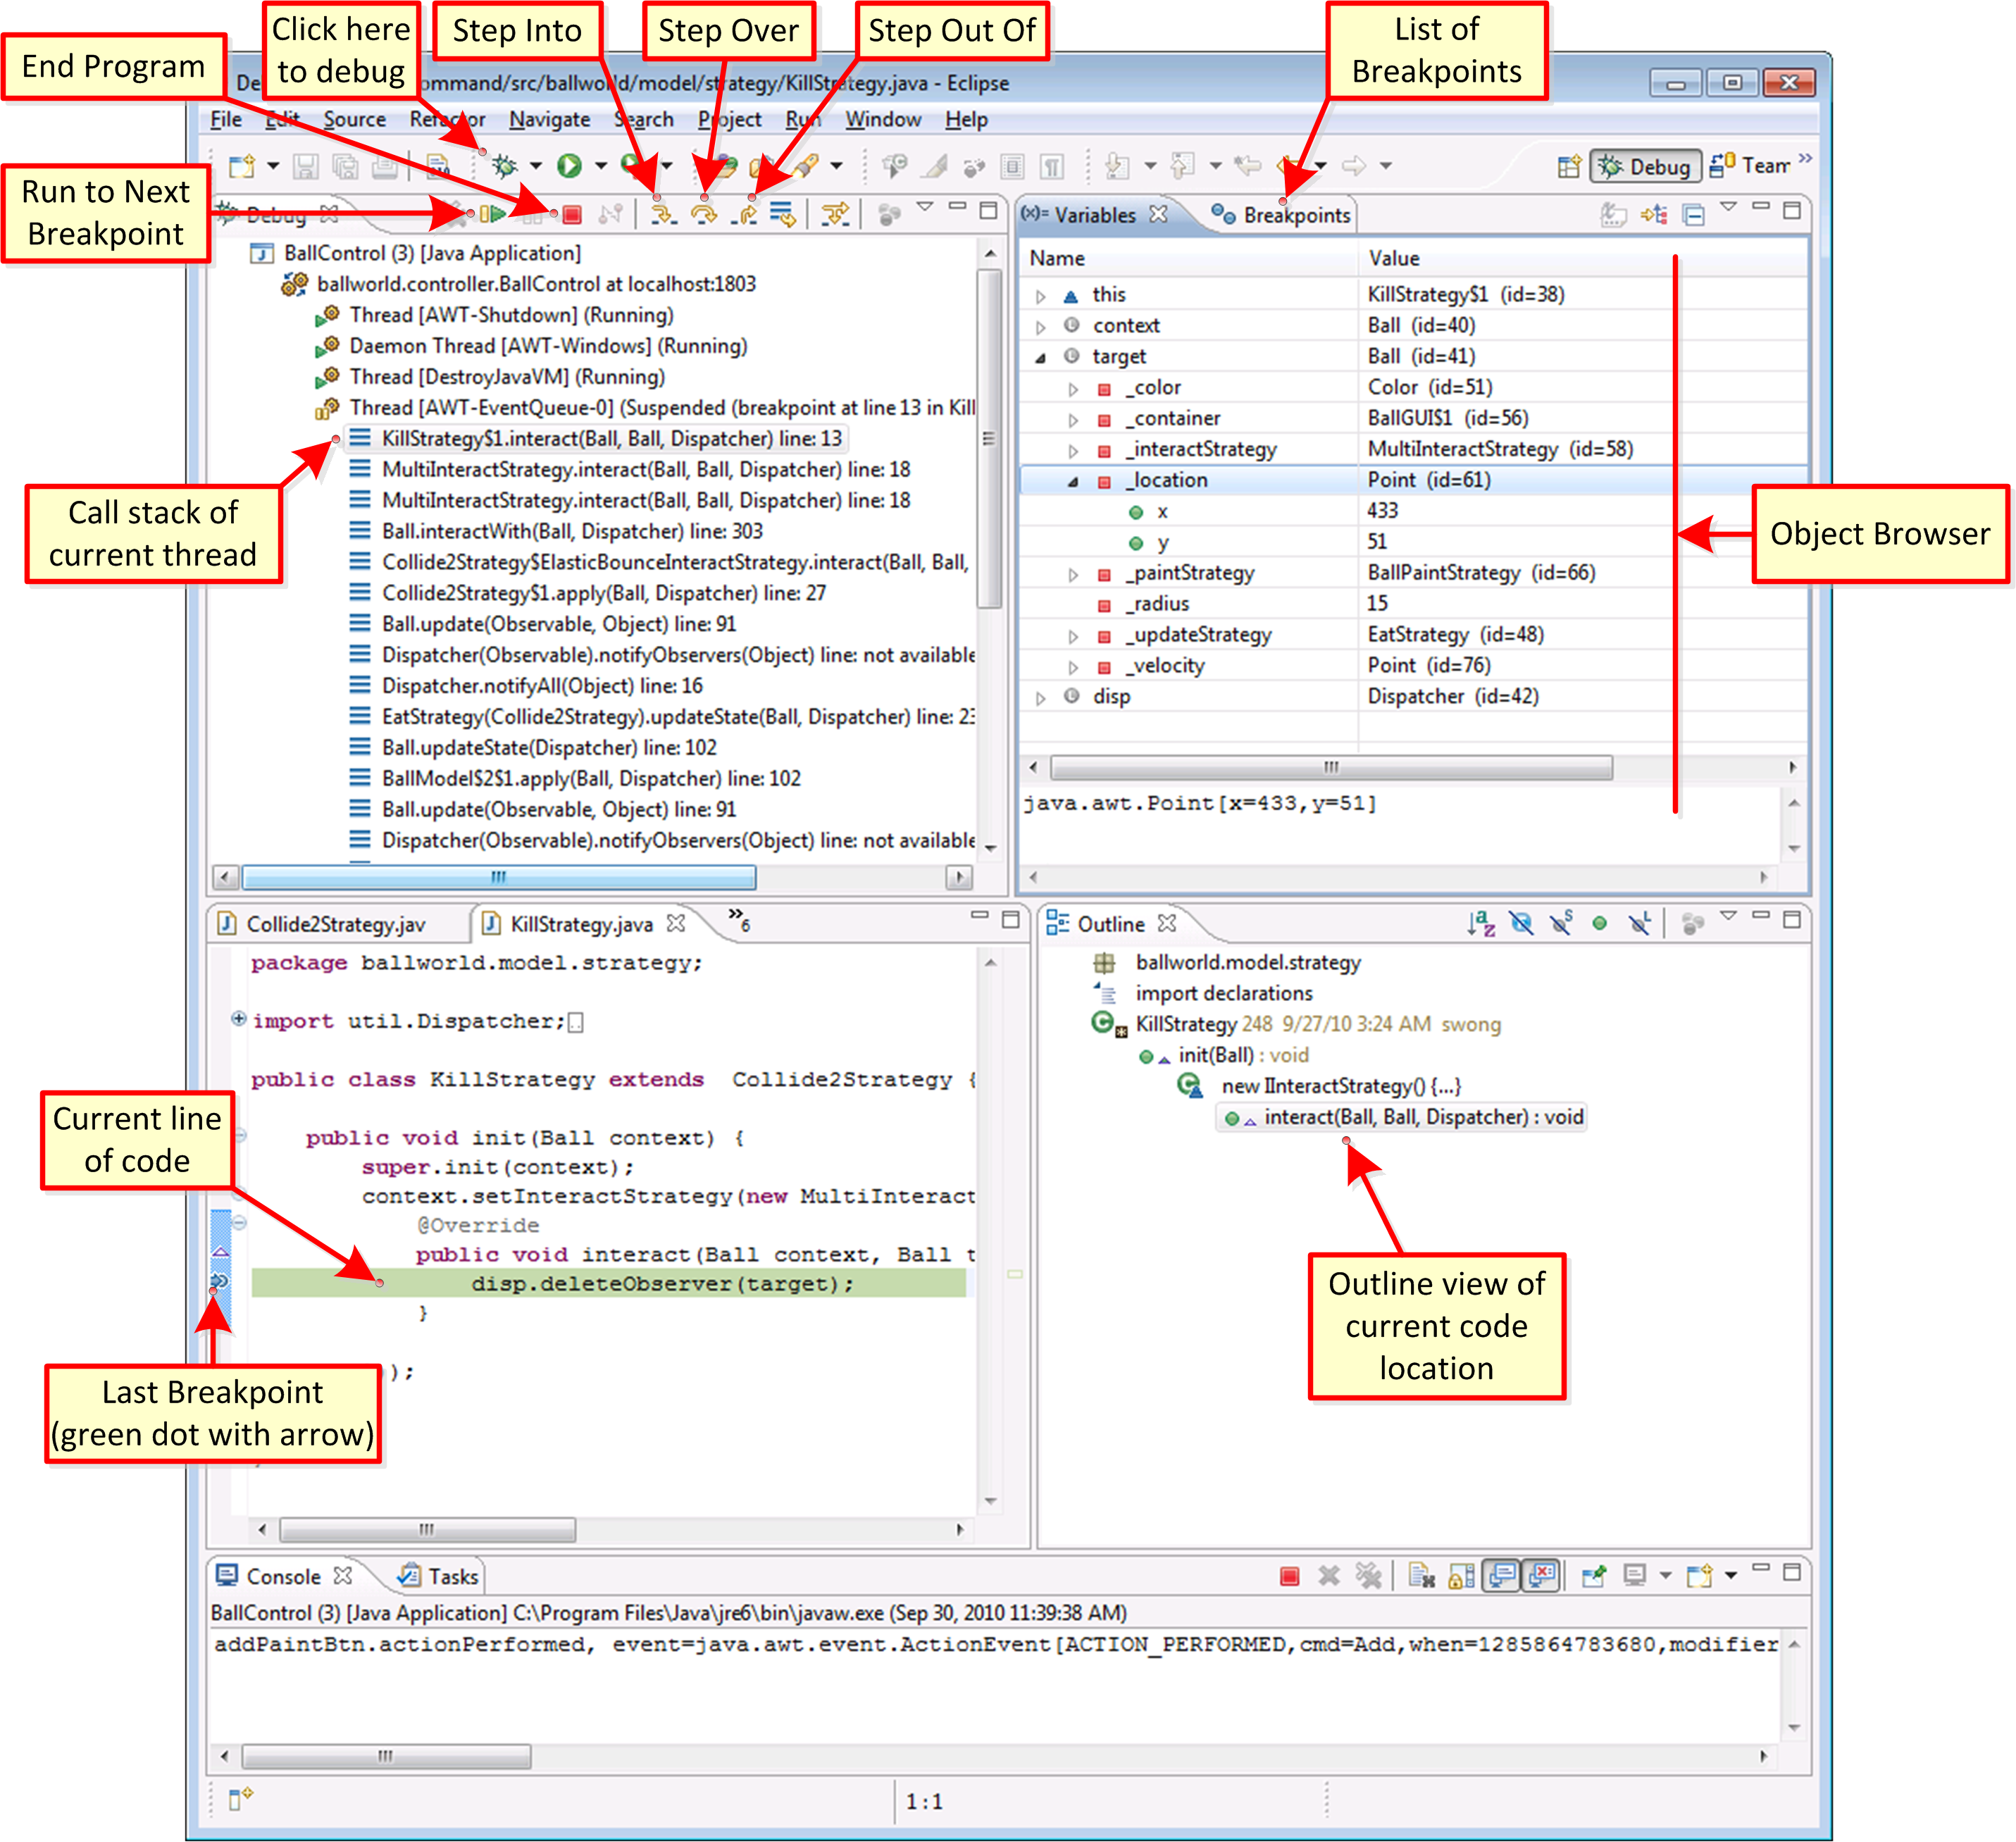
- When the Debugger pauses a program at a breakpoint, Eclipse will open the “Debug perspective,” and provide some controls to you
 “Step Over” will move to the next function call or line of code in the file that contained the breakpoint. In the example above, the FIRST “step over” will run until _default_strategy.make_strategy(). The SECOND “step over” will run all of the code in _default_strategy.make_strategy(), and pause still on line 142, ready to run new MotionSwitchStrategy(…). The THIRD “step over” will finish line 142’s new MotionSwitchStrategy, and pause at line 145. “Step Over” is the way to get to the line that you really care about.
 “Step Into” will run the very next line of code, wherever it may be. In the example above, the FIRST “Step Into” will also run until it finds _default_strategy.make_strategy(), as that is the very first thing that must happen on line 142. The SECOND “step into” will go to the file that defines whatever type of object _default_strategy is – in this case, it is an anonymous inner class created in the Controller, so we’ll be sitting at line 1 in the controller. The THIRD “step into” will go to the first line of the make_strategy() method. You could then use “step over” to walk through the lines of code in make_strategy(). “Step Into” is a good way to dig into the inner workings of the line of code you care about.
 “Step Return” will run through lines of code in whichever method you are currently in, until a “return” line is found. It will complete the return, and then pause again. In the example above, clicking “Step Return” anywhere inside the make_strategy() method will bring us back to line 143, where make_strategy() has just finished completing. “Step Return” is the quick way to get yourself out of a hole you dug yourself into with “Step Into.”
- When debugging, you can help yourself understand what is going on by only having one method call per line of code. Instead of the example code above, the following would be much easier to debug:

Easier to Debug
Resources
- Debugging in Eclipse: http://www.clear.rice.edu/comp310/Eclipse/debugging.html
- Screenshot of Eclipse’s “Debug Perspective:” http://www.clear.rice.edu/comp310/Eclipse/debug_screen_annotated.png